To improve security this site is passwordless. A one time use login link wil be sent to your email. This link expires in 15 minutes. All data will be assocated with the email address you send a login link to.
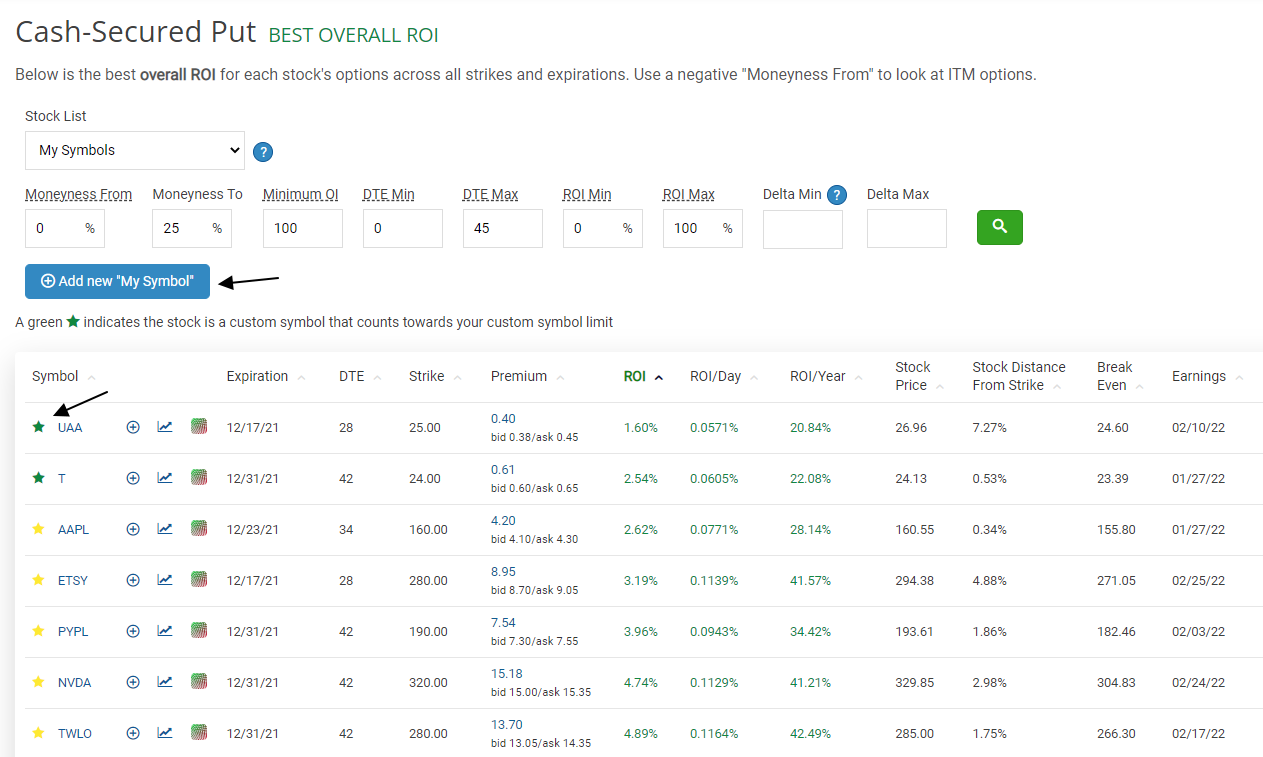
Cash-Secured Put
BEST OVERALL ROI
Below is the best overall ROI for each stock's options across all strikes and expirations. Use a negative "Moneyness From" to look at ITM options.
Cash-Secured Put
BEST ROI PER DAY
Below is the best ROI per day for each stock's options across all strikes and expirations. Use a negative "Moneyness From" to look at ITM options.
Covered Call
BEST OVERALL ROI
Below is the best overall ROI for each stock's options across all strikes and expirations. Use a negative "Moneyness From" to look at ITM options.
Covered Call
BEST ROI PER DAY
Below is the best ROI per day for each stock's options across all strikes and expirations. Use a negative "Moneyness From" to look at ITM options.
-
Add new "My Symbol"
- {{row.OptionPremium}}
- bid {{row.Bid}}/ask {{row.Ask}}

The "My Symbols" list is a way to collect symbols that are auto scanned into one list.
To save symbols and view them in the "My Symbols" list you'll need to login. Then click on the star icon next to symbols in the ROI searches.
Patreon subscribers contributing up to $4/month can add 5 custom symbols. At $5/month or more you can add 2 symbols for each $1 of your monthly contribution up to 20 total.
Symbol Search
Find the best ROI for selling {{grids.symbolData.searchCrit.Type == 'put' ? 'cash-secured puts' : 'covered calls'}} across all strikes and expirations. Use a negative "Moneyness From" to look at ITM options.
-
TradingView Chart -
Share this data -
Earnings: {{grids.symbolData.data[0].NextEarnings}}
- {{row.OptionPremium}}
- bid {{row.Bid}}/ask {{row.Ask}}
Option Tracker
Track your options trades
Using this tool you can track your options trades including sold puts, sold calls as well as regular puts and calls.
Quickly gain insight into how your trades are performing. With data on expected ROI and current ROI you'll be able to better identify options that can be left open, need to be closed or rolled.
These tools are free and can only exist with site supporters.
To get started you'll need to Login
| Symbol | Moneyness | Type | Cost Basis | Option Last | Expected ROI | Current ROI |
|---|---|---|---|---|---|---|
| FUBO | 5% OTM | Sold Put | 2.50 | 1.50 | 9% | 3.5% |
| SOFI | 9% OTM | Sold Put | 1.20 | 0.60 | 6% | 3% |
| TSLA | -3% ITM | Sold Call | 38.00 | 63.00 | 4.5% | -3% |
| SQ | 8% OTM | Sold Call | 12 | 4.5 | 4.8% | 3% |
Keep track of your progress
This site is all about helping you find the best ROI for option selling to maximize your profits. By logging your trades you can track how well you are meeting your goals.
Features
- Multiple portfolios
- Share your trades with a public URL
- Trade stats
- Realtime view of how an open trade is performing
-
Add Trade -
View Stats -
{{(selectedPortfolio.PortfolioShareToken || '') !== '' ? 'Stop sharing portfolio' : 'Share portfolio' }}
Portfolio: {{grids.optionTrack.publicviewName}}
Twitter: @{{grids.optionTrack.publicviewTwitter}}
- Data definitions
- Export To CSV
-
{{grids.optionTrack.isDetailedView ? 'Show Basic Data' : 'Show Detailed Data'}}
This list is generated by scanning high IV stocks from Swaggy Stocks FD Rankr periodically. Check the updated date for the last update. To view more recent options data check the Symbol Search or click a symbol in the grid.
This list is generated by scanning Wall Street Bets most mentioned stocks via the Swaggy Stocks Wall Street Bets Ticker Sentiment page periodically. Check the updated date for the last update. To view more recent options data check the Symbol Search or click a symbol in the grid.
Delta measures how much an option will shift in relation to changes in the price of the underlying stock.
For a put delta will range between -1 and 0. If a put option has a delta of -0.5 then the price of the option will increase $0.50 for each $1 the underlying stock goes down.
For a call delta will range between 0 and 1. If a call option has a delta of 0.5 then the price of the option will increase $0.50 for each $1 the underlying stock rises.
As options move futher in the money the delta will move closer to 1 (calls) or -1 (puts) and the option price will move in step with the underlying stock.
Are you sure you want to delete this trade?
Are you sure you want to delete this portfolio?
The "My Symbols" list is a way to collect symbols that are auto scanned into one list.
To save symbols and view them in the "My Symbols" list you'll need to login. Then click on the star icon next to symbols in the ROI searches.
Patreon subscribers contributing up to $4/month can add 5 custom symbols. At $5/month or more you can add 2 symbols for each $1 of your monthly contribution up to 20 total.
- *Closed trades include the "Other profit / loss" data in "Final ROI" column
- The underlying stock symbol
- The type of option. One of the following: Sold Put, Sold Call, Call or Put
- Option expiration date
- Days until the option expires
- The average cost of your options. For example if you added positions as the price changed this would reflect the average price of the purchases
- If an option has not been closed this will show the current option value
- The price that you either bought to close or sold to close your option
- How many of a given option you opened
- How much premium you collected for a sold option or how much profit you made on the value of an option that you bought to open
- Used to track extra profit / loss such as fees and assignment related profit / loss
- The strike price of the option
-
The percentage of how far in the money (ITM) or out of the money (OTM) the strike currently is.
For a put if the stock price is below the strike it is ITM and the value will be negative
For a call if the stock price is above the strike you are ITM and the value will be negative -
For a sold option this would be (premium / strike) * 100. So if you sold a put for $1 premium and the strike is $10 your expected ROI would be 10%
Covered calls have other factors to include such as the difference between the underlying stock purchase price and the strike. For simplicity the expected ROI is just calculated based on the premium relative to the strike - Your ROI based on the option last price. For a sold option this would be (cost basis - option last) / strike * 100. For a bought option it would be (option last - cost basis) / cost basis * 100
- For a sold option, how much of your expected ROI you have currently earned. Calculated as current roi / expected roi
- ROI based on the closed price. For a sold option this would be (cost basis - close price) / strike * 100. For a bought option it would be (close price - cost basis) / cost basis * 100
- Date the trade was opened
- Date the trade was closed
- Whether or not your option was assigned
Monthly Options Performance
*Chart data for closed positions only
Stats For Search Results - {{statsModal.display.dateRange}} {{grids.optionTrack.searchCrit.Symbol ? ' - ' + grids.optionTrack.searchCrit.Symbol : ''}}
Stats For Search Results - {{statsTitle}} {{grids.optionTrack.searchCrit.Symbol ? ' - ' + grids.optionTrack.searchCrit.Symbol : ''}}
*ROI on open trades are based on the last price of the option if available. If the last option price is not available a value of 0 is assumed for options you sold and your cost basis for options you bought.
Loading trading data...
| Type | Trades | Capital Used |
Profit/Premium | Other Profit/Loss |
Avg ROI |
|---|---|---|---|---|---|
| Cash Secured Puts | {{statsModal.data.TradesCSP}} | {{statsModal.data.CapitalCSP}} | {{statsModal.data.PremiumCSP}} | {{statsModal.data.AdditionalPCSP}} | {{statsModal.data.ROICSP}} |
| Covered Calls | {{statsModal.data.TradesCC}} | {{statsModal.data.CapitalCC}} | {{statsModal.data.PremiumCC}} | {{statsModal.data.AdditionalPCC}} | {{statsModal.data.ROICC}} |
| Puts | {{statsModal.data.TradesP}} | {{statsModal.data.CapitalP}} | {{statsModal.data.ProfitP}} | {{statsModal.data.AdditionalPP}} | {{statsModal.data.ROIP}} |
| Calls | {{statsModal.data.TradesC}} | {{statsModal.data.CapitalC}} | {{statsModal.data.ProfitC}} | {{statsModal.data.AdditionalPC}} | {{statsModal.data.ROIC}} |
| Total | {{statsModal.data.TotalTrades}} | {{statsModal.data.TotalCapital}} | {{statsModal.data.TotalProfit}} | {{statsModal.data.TotalAdditional}} | {{statsModal.data.TotalROI}} |
New symbols that are not already auto scanned will count towards your custom "my symbol" limit.
- You have {{mySymbolRemaining}} custom symbols remaining of your {{mySymbolLimit}} symbol limit
-
Patreon subscribers can add 2 custom symbols for each $1 of their monthly contribution up to 10 total. So if you are a $5 / month Patreon subscriber you can add up to the max of 10 custom symbols.
After signing up on Patreon you will be notified once access to "My Symbols" has been added.
-
- {{isMySymbolAutoScanned ? mySymbolModal.form.newSymbol + ' is auto scanned and will not count against your limit' : mySymbolModal.form.newSymbol + ' is not auto scanned and will count against your limit' }}